Step 4 - Verify Git Commit
June 28, 2023
Updated Dec 18, 2025
-
![]() Thomas Jungbauer
-
3 min read
(653 words)
Thomas Jungbauer
-
3 min read
(653 words)
Besides checking the source code quality, we should also verify if the commit into Git was done by someone/something we trust. It is a good practice to sign all commits to Git. You need to prepare your Git account and create trusted certificates.
| I will not describe how exactly you need to configure Git to sign your commit. Verify the following link to learn more about Signing Commits |
Goals
The goals of this step are:
Verify if the last commit has been signed
Prerequisites
Signing public key
Configured Git to verify your gpg signature
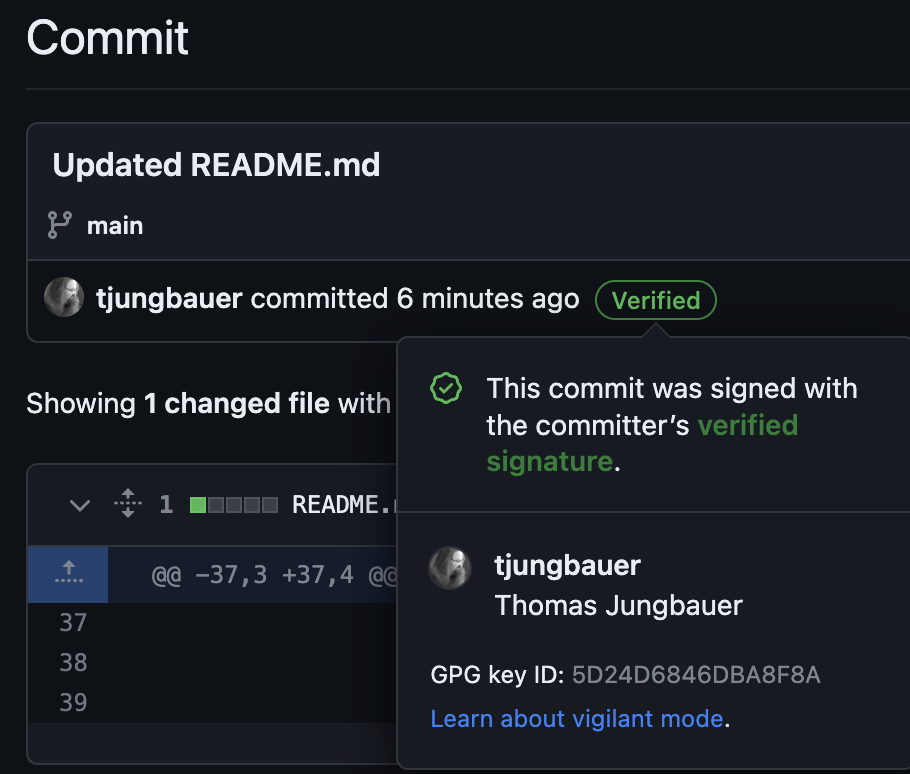
When your commit is signed, Git will show that:
Steps
Create the following Secret that contains your PUBLIC key.
kind: Secret
apiVersion: v1
metadata:
  name: gpg-public-key
  namespace: ci
data:
  public.key: >-
    <Base64 PUBLIC GPG KEY> (1)
type: Opaque
1 Public key, containing BEGIN/END lines base64 encoded. Create the following Task:
apiVersion: tekton.dev/v1
kind: Task
metadata:
  name: verify-source-code-commit-signature
  namespace: ci
spec:
  description: This task verifies the latest commit and signature against the gpg
    public key
  params:
    - default: 'registry.redhat.io/openshift-pipelines/pipelines-git-init-rhel8:v1.10.4-4'
      name: gitInit
      type: string
  steps:
  - computeResources: {}
    image: $(params.gitInit)
    name: git-verify
    script: |
      set -x (1)

      gpg --import /workspace/secrets/public.key

      git config --global --add safe.directory /workspace/repository

      git verify-commit HEAD || (echo "Unable to verify commit at HEAD!" && exit 1)
    workingDir: /workspace/repository
  workspaces:
  - name: repository
  - name: secrets (2)
1 The script to verify the signature of the commit, 2 The workspace that mounts the Secret containing the gpg key, Modify the TriggerTemplate and add the following 3 lines
        workspaces:
...
          - name: secrets
            secret:
              secretName: gpg-public-key (1)
1 The name of the Secret where the public key can be found. Update the pipeline to execute the task verify-commit-signature, which is running in parallel to the SonarQube scan.
    - name: verify-commit-signature
      runAfter:
        - pull-source-code (1)
      taskRef:
        kind: Task
        name: verify-source-code-commit-signature (2)
      workspaces: (3)
        - name: repository
          workspace: shared-data
        - name: secrets
          workspace: secrets
  workspaces:
    ...
    - name: secrets (4)
1 This task runs after pull-source-code but in parallels with the SonarQube task. 2 Task reference 3 Workspaces that are used in this Task 4 Additional workspace for the Pipeline
The full pipeline objects now look like the following:
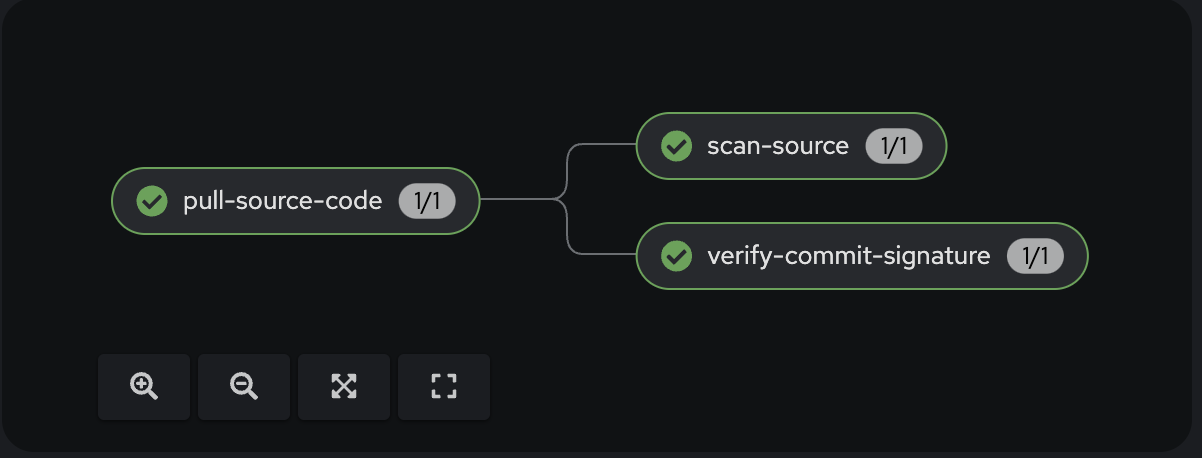
The status of the Pipeline now is:

Execute the Pipeline
Let’s update the README.md of our source code again to trigger another PipelineRun.
Now the 3rd task will verify if the commit was signed.
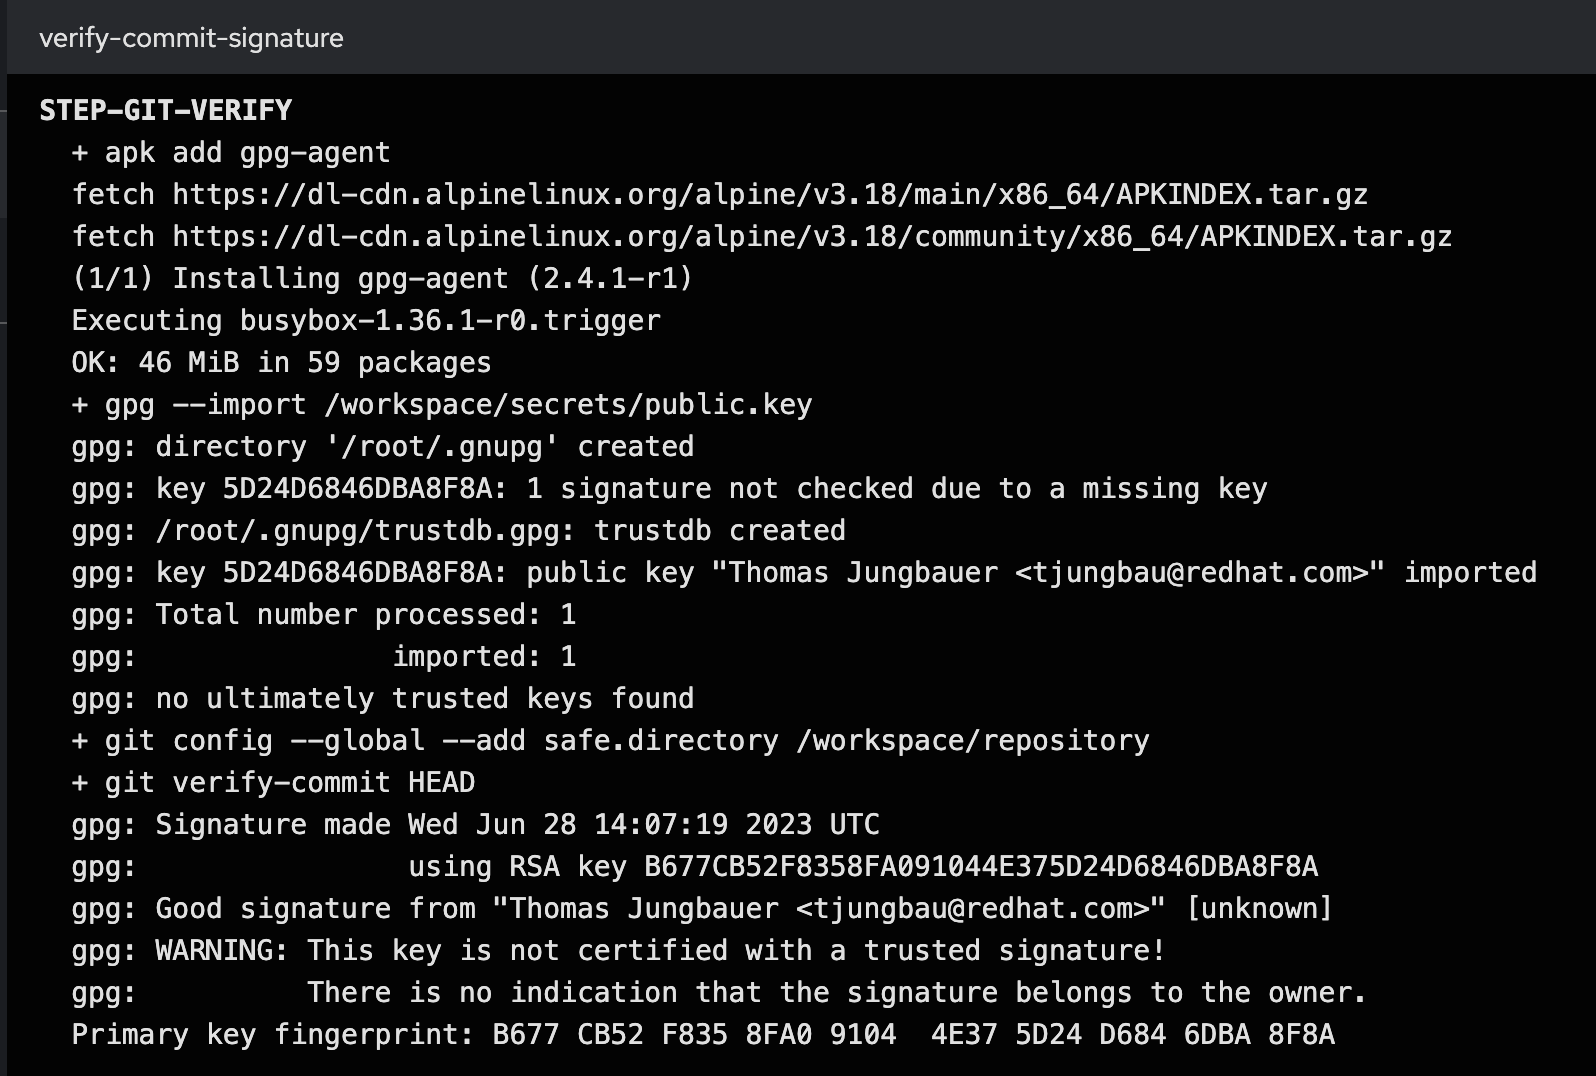
In the logs of the Task, we can see that the commit was signed and could be verified. See:
...
gpg: Good signature from "Thomas Jungbauer <tjungbau@redhat.com>"
...
Summary
At this stage we have a Pipeline, that pulls our code, does a code analysis, and verifies if the commit has been signed. The very next step is to build the image and push it into an Image Registry.
Related Articles
Copyright © 2020 - 2026 Toni Schmidbauer & Thomas Jungbauer
Discussion
Comments are powered by GitHub Discussions. To participate, you'll need a GitHub account.
By loading comments, you agree to GitHub's Privacy Policy. Your data is processed by GitHub, not by this website.