Thanos Querier vs Thanos Querier
- By: Thomas Jungbauer ( Lastmod: 2021-08-14 ) - 9 min read
OpenShift comes per default with a static Grafana dashboard, which will present cluster metrics to cluster administrators. It is not possible to customize this Grafana instance.
However, many customers would like to create their own dashboards, their own monitoring and their own alerting while leveraging the possibilities of OpenShift at the same time and without installing a completely separated monitoring stack.
So how can you create your own queries? How can you visualize them on custom dashboards, without the need to install Prometheus or Alertmanager a second time?
The solution is simple: Since OpenShift 4.5 (as TechPreview) and since OpenShift 4.6 (as GA) the default monitoring stack of OpenShift has been extended to support monitoring of user-defined projects. This additional configuration will help to observe your own projects.
In this article we will see how to deploy the Grafana operator and what the possible issues can occur, when simply connecting Grafana to the OpenShift monitoring.
Overview
As a developer in OpenShift, you can create an application which provides your custom statistics of your application at the endpoint /metrics. Here the example from the official OpenShift documentation:
# HELP http_requests_total Count of all HTTP requests
# TYPE http_requests_total counter
http_requests_total{code="200",method="get"} 4
http_requests_total{code="404",method="get"} 2
# HELP version Version information about this binary
# TYPE version gauge
version{version="v0.1.0"} 1
This metric can then be viewed inside OpenShift in the developer view under the menu Monitoring. If you go to "Monitoring > Metrics" and select "Custom Query" from the drop down, you can enter, for example, the following PromQL query:
sum(rate(http_requests_total[2m]))The following graph will be the result:

This is great! But … what happens if a customer would like to see his very own super fancy Grafana dashboard? You cannot change the cluster dashboard. However, you can install your own Grafana instance and one way to do so is using the Custom Grafana Operator.
Before we begin
Before we start the following should be prepared already:
OpenShift 4.5+
Enabled user-define workload monitoring
A project with user-defined workload monitoring. This is explained in the official documentation at https://docs.openshift.com/container-platform/4.6/monitoring/enabling-monitoring-for-user-defined-projects.html.
During this blog, we will use the namespace ns1 with a custom metric
Deploy Custom Grafana Operator
As for any community operator the following must be considered:
| Community Operators are operators which have not been vetted or verified by Red Hat. Community Operators should be used with caution because their stability is unknown. Red Hat provides no support for Community Operators. |
The community Grafana operator must be deployed to its own namespace, for example grafana. Create this namespace first (oc new-project grafana) and search and intall the Grafana Operator from the OperatorHub. You can use the default values, just be sure to select the wanted namespace.
After a few minutes, the operator should be available:

Setup Grafana Operator
Before we can use Grafana to draw beautiful images it must be configured. We need to create an instance of Grafana. Ideally, OpenShift OAuth is already leveraged, to avoid the need to creating user account manually, inside Grafana.
OAuth requires some objects, which must be created before the actual Grafana instance. The following YAMLs are taken from the operator documentation. Create the following inside the Grafana namespace:
Session secret for the proxy … change the password!!
a cluster role grafana-proxy
a cluster role binding for the role
a config map injecting trusted CA bundles
apiVersion: v1
data:
  session_secret: Y2hhbmdlIG1lCg==
kind: Secret
metadata:
  name: grafana-k8s-proxy
type: Opaque
---
apiVersion: rbac.authorization.k8s.io/v1
kind: ClusterRole
metadata:
  name: grafana-proxy
rules:
  - apiGroups:
      - authentication.k8s.io
    resources:
      - tokenreviews
    verbs:
      - create
  - apiGroups:
      - authorization.k8s.io
    resources:
      - subjectaccessreviews
    verbs:
      - create
---
apiVersion: authorization.openshift.io/v1
kind: ClusterRoleBinding
metadata:
  name: grafana-proxy
roleRef:
  name: grafana-proxy
subjects:
  - kind: ServiceAccount
    name: grafana-serviceaccount
    namespace: grafana
userNames:
  - system:serviceaccount:grafana:grafana-serviceaccount
---
apiVersion: v1
kind: ConfigMap
metadata:
  labels:
    config.openshift.io/inject-trusted-cabundle: "true"
  name: ocp-injected-certs
Now you can create the following instance under: "Installed Operators > Grafana Operator > Grafana > Create Grafana > YAML View" (or, as an alternative, via the CLI)
apiVersion: integreatly.org/v1alpha1
kind: Grafana
metadata:
  name: grafana-oauth
  namespace: grafana
spec:
  config: (1)
    auth:
      disable_login_form: false
      disable_signout_menu: true
    auth.anonymous:
      enabled: false
    auth.basic:
      enabled: true
    log:
      level: warn
      mode: console
    security: (2)
      admin_password: secret
      admin_user: root
  secrets:
    - grafana-k8s-tls
    - grafana-k8s-proxy
  client:
    preferService: true
  dataStorage: (3)
    accessModes:
      - ReadWriteOnce
    class: managed-nfs-storage
    size: 10Gi
  containers: (4)
    - args:
        - '-provider=openshift'
        - '-pass-basic-auth=false'
        - '-https-address=:9091'
        - '-http-address='
        - '-email-domain=*'
        - '-upstream=http://localhost:3000'
        - '-tls-cert=/etc/tls/private/tls.crt'
        - '-tls-key=/etc/tls/private/tls.key'
        - >-
          -client-secret-file=/var/run/secrets/kubernetes.io/serviceaccount/token
        - '-cookie-secret-file=/etc/proxy/secrets/session_secret'
        - '-openshift-service-account=grafana-serviceaccount'
        - '-openshift-ca=/etc/pki/tls/cert.pem'
        - '-openshift-ca=/var/run/secrets/kubernetes.io/serviceaccount/ca.crt'
        - '-openshift-ca=/etc/grafana-configmaps/ocp-injected-certs/ca-bundle.crt'
        - '-skip-auth-regex=^/metrics'
        - >-
          -openshift-sar={"namespace": "grafana", "resource": "services",
          "verb": "get"}
      image: 'quay.io/openshift/origin-oauth-proxy:4.8'
      name: grafana-proxy
      ports:
        - containerPort: 9091
          name: grafana-proxy
      resources: {}
      volumeMounts:
        - mountPath: /etc/tls/private
          name: secret-grafana-k8s-tls
          readOnly: false
        - mountPath: /etc/proxy/secrets
          name: secret-grafana-k8s-proxy
          readOnly: false
  ingress:
    enabled: true
    targetPort: grafana-proxy
    termination: reencrypt
  service:
    annotations:
      service.alpha.openshift.io/serving-cert-secret-name: grafana-k8s-tls
    ports:
      - name: grafana-proxy
        port: 9091
        protocol: TCP
        targetPort: grafana-proxy
  serviceAccount:
    annotations:
      serviceaccounts.openshift.io/oauth-redirectreference.primary: >-
        {"kind":"OAuthRedirectReference","apiVersion":"v1","reference":{"kind":"Route","name":"grafana-route"}}
  configMaps:
    - ocp-injected-certs
  dashboardLabelSelector:
    - matchExpressions:
        - key: app
          operator: In
          values:
- grafana| 1 | Some default settings, which can be modified if required |
| 2 | A default administrative user |
| 3 | A datastore to use a persistent volume. Other options would be to use ephemeral storage, or another database. This might be especially important, if you would like HA for your Grafana. |
| 4 | Container arguments, most important the openshift-sar line which is important for the OAuth |
After a few moments, the operator will pick up the change and creates a Grafana pod.
Adding a Data Source
The next step is to connect your custom Grafana to Prometheus, or actually to the Thanos Querier. To do so, you will need to add a role to the Grafana service account and to create a CRD GrafanaDataSource.
At this moment, we will work with the cluster role cluster-monitoring-view. The problem this might bring is discussed later.
Add the role to the Grafana serviceaccount
oc adm policy add-cluster-role-to-user cluster-monitoring-view -z grafana-serviceaccountRetrieve the token of the service account
oc serviceaccounts get-token grafana-serviceaccount -n grafanaCreate the following Grafana Data Source, either via UI or via CLI. Be sure to change <TOKEN> with the token from step #2.
apiVersion: integreatly.org/v1alpha1
kind: GrafanaDataSource
metadata:
  name: prometheus-grafanadatasource
  namespace: grafana
spec:
  datasources:
    - access: proxy
      editable: true
      isDefault: true
      jsonData:
        httpHeaderName1: Authorization
        timeInterval: 5s
        tlsSkipVerify: true
      name: Prometheus
      secureJsonData:
        httpHeaderValue1: >-
          Bearer <TOKEN> (1)
      type: prometheus
      url: 'https://thanos-querier.openshift-monitoring.svc.cluster.local:9091' (2)
  name: prometheus-grafanadatasource.yaml
1 enter token from step #2 2 Thanos default querier URL…. this might cause problems (see below)
The operator will now restart the Grafana pod to add the newest changes, which should not take more than a few seconds. Grafana can be used now. Dashboards can be created … but lets run some tests with PromQL queries instead.
Let’s Test
Log in to your Grafana using OAuth and a cluster administrator.
| You could also use a non cluster administrator, if the user is able to GET the services of the Grafana namespace. The reason is the following line in the Grafana CRD: -openshift-sar={"namespace": "grafana", "resource": "services","verb": "get"} which defines, that OAuth will work for everybody who can get the service. This might be changed according to personal needs, but for this test it is good enough. |
Then use the credentials for the admin account, which have been defined while creating the Grafana instance.
You will be logged in now and since there are no Dashboards, lets go to Explore to enter some custom PromQL queries, for instance our example from above:
sum(rate(http_requests_total[2m]))
This is looking good.
Let’s give it another try and sort by namespaces.
sum(rate(http_requests_total[2m])) by (namespace)
What is this? I see a namespace which is actually meant for the cluster (openshift-monitoring).
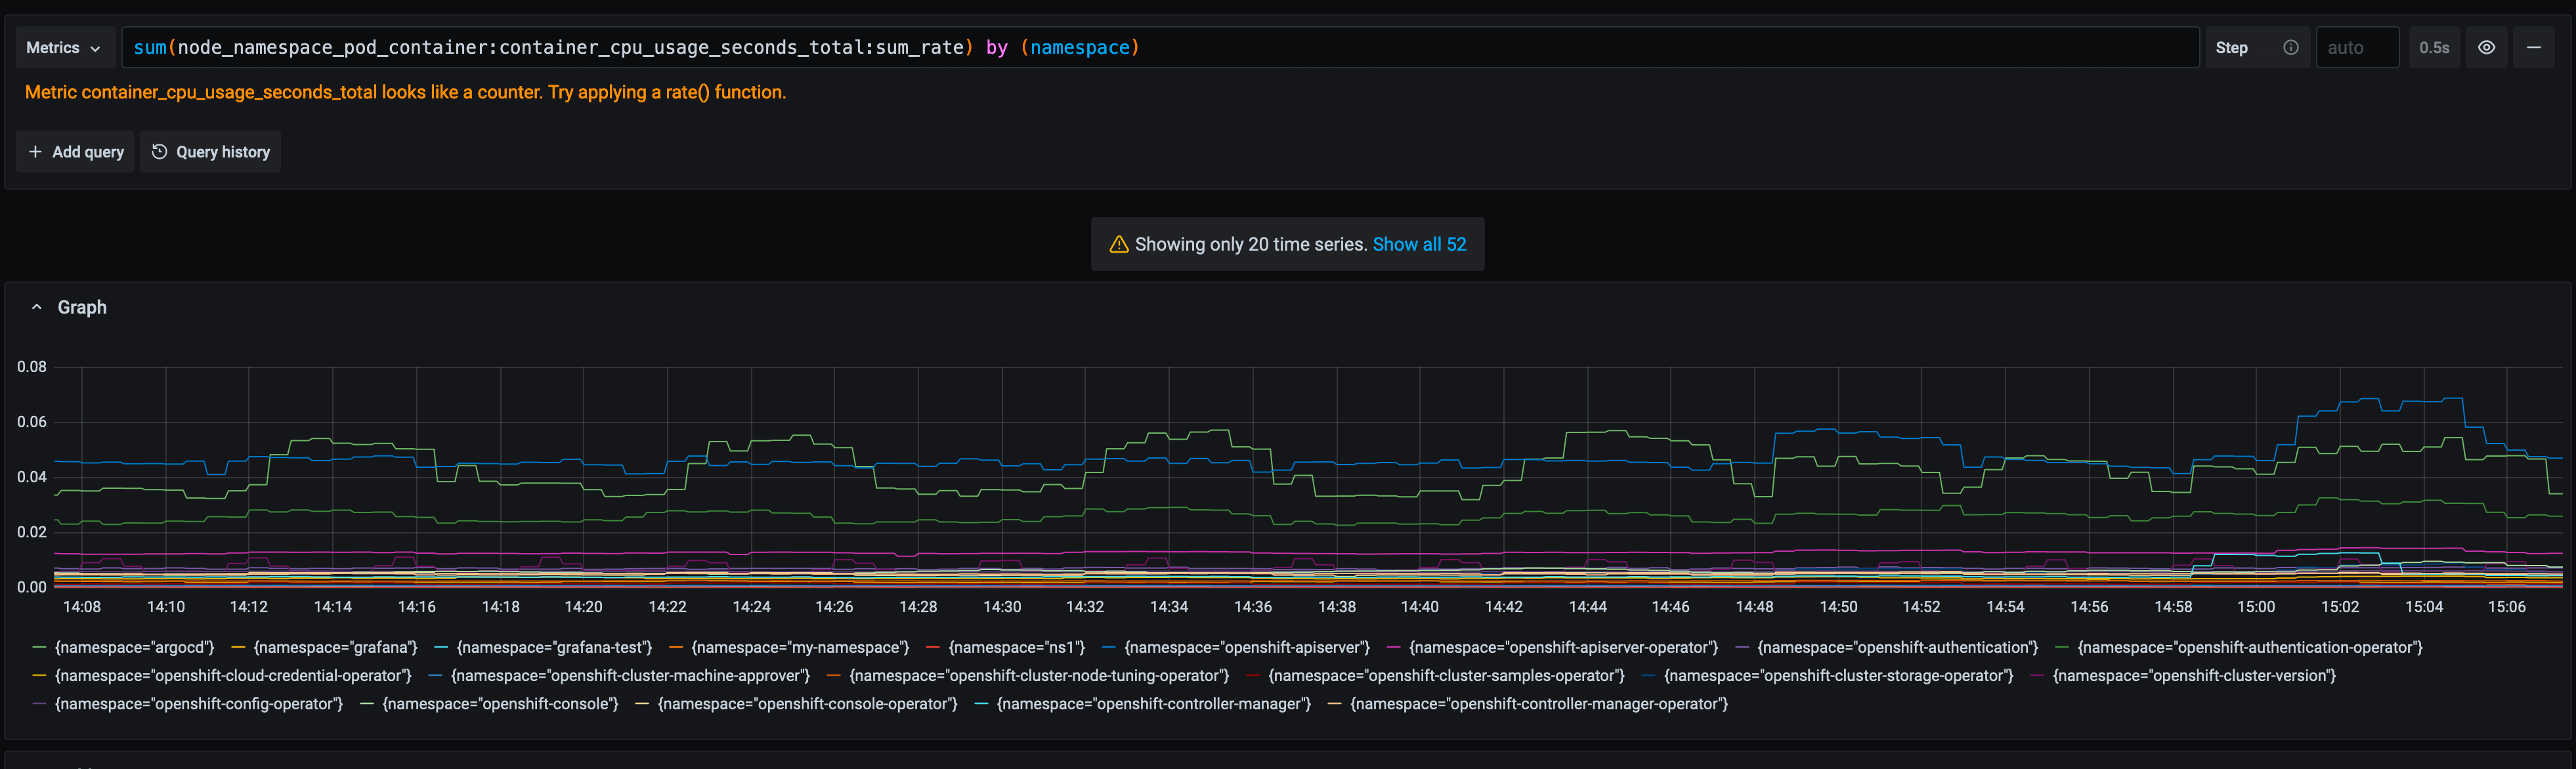
Let’s try another query using a different metric:
sum(node_namespace_pod_container:container_cpu_usage_seconds_total:sum_rate) by (namespace)
Ok, so we have access to all namespaces on the cluster.
Why do I see all namespaces?
What does this mean? Well, it means that we have access to all namespaces of the cluster. We see everything. This makes sense, since we assign the cluster role "cluster-monitoring-view" to the serviceaccount of Grafana. But what if we want to show only objects from a specific namespace? If we want, for example, give the developers the possibility to create their own dashboards, without having view access to the whole cluster.
The first test might be to remove the cluster-monitoring-view privileges from the Grafana serviceaccount. This will lead to an error on Grafana itself, since it cannot access the Thanos Querier, which we configured with: https://thanos-querier.openshift-monitoring.svc.cluster.local:9091
How does the Openshift WebUI actually work, when you are a developer and would like to search one of the above queries. Let’s try that:

It works! It shows the namespace of the developer and only this namespace. When you inspect the actual network traffic, you will see that OpenShift automatically adds the URL parameter namespace=ns1 to the request URL:
https://your-cluster/api/prometheus-tenancy/api/v1/query?namespace=ns1&query=sum%28node_namespace_pod_container%3Acontainer_cpu_usage_seconds_total%3Asum_rate%29+by+%28namespace%29This is good information, let’s try this using the Grafana Data Source.
| It is currently not possible to perform this configuration using the GrafanaDataSource CRD. Instead, it must be done directly at the Grafana Dashboard configuration. There is an open ticket at: https://github.com/integr8ly/grafana-operator/issues/309 |
Login to Grafana as administrator and switch to "Configuration > Data Source > Prometheus >". At the very bottom add namespace=ns1 to the Custom query parameters

| At this point the Grafana serviceaccount has cluster_monitoring_view privileges. |
As you can see in the following image, this configuration did not help.
Thanos Querier vs. Thanos Querier
To summarize, in the OpenShift UI everything works, but when using the Grafana dashboard, we see all namespaces from the cluster. Let’s try to find out how OpenShift does this.
When we check the Thanos services we will see 3 ports:
  ports:
    - name: web
      protocol: TCP
      port: 9091
      targetPort: web
    - name: tenancy
      protocol: TCP
      port: 9092
      targetPort: tenancy
    - name: tenancy-rules
      protocol: TCP
      port: 9093
      targetPort: tenancy-rules
Currently we configured port 9091, but there is another one, which is called tenancy, maybe this is what we need? Let’s try it:
Change the CRD GrafanaDataSource to use port 9092 (instead of 9091). This will restart the pod and remove the custom query parameter we configured earlier.
Remove the cluster-role
oc adm policy remove-cluster-role-from-user cluster-monitoring-view -z grafana-serviceaccountThe serviceaccount of Grafana, must be able to view the project we want to show in the dashboards. Therefore, allow the Grafana serviceaccount to view the project ns1:
oc adm policy add-role-to-user view system:serviceaccount:grafana:grafana-serviceaccount -n ns1Log into Grafana as administrator and manually change the Data Source and add namespace=ns1 to the setting Custom query parameters
Rerun the Query … as you see you will now see one namespace only.
 Figure 9. Query with Thanos Querier on port 9092
What happened?
So what actually happened here? We have two ports for our Thanos Querier which are important: 9091 and 9092.
When we check the Deployment of the Thanos Querier for these ports we will see:
For the port 9091 it looks like the following:
spec:
[...]
      containers:
[...]
        - resources:
[...]
          ports:
            - name: web
              containerPort: 9091
              protocol: TCP
[...]
          args:
[...]
            - '-openshift-sar={"resource": "namespaces", "verb": "get"}'
There is an OAuth setting which says: you have to have the privilege to GET the objects "namespace".
The only cluster role which has exactly this privilege and which is also mentioned by the official OpenShift documentation is cluster-monitoring-view
 - apiVersion: rbac.authorization.k8s.io/v1
   kind: ClusterRole
   metadata:
     name: cluster-monitoring-view
   rules:
   - apiGroups:
     - ""
     resources:
     - namespaces
     verbs:
     - get
As we have seen above, this will show you all namespaces available on the cluster.
When you check port 9092 there is no such OAuth configuration. This service is actually in front of the container kube-rbac-proxy. It does not require OAuth, but instead the namespace URL parameter.
Details can be found at: https://github.com/openshift/enhancements/blob/master/enhancements/monitoring/user-workload-monitoring.md
In short the whole setup looks like this:

While port 9091 goes directly to Thanos it will require that you have the cluster-monitoring-view role. Port 9092 does not require this, but instead you MUST send the URL parameter namespace=.
Summary
While both options are valid, some considerations must be done when using the Grafana Operator.
Currently the URL parameter can be set in Grafana directly only. The operator will ignore it. The ticket in the project shall address this, but is not yet implemented: https://github.com/integr8ly/grafana-operator/issues/309
The URL parameter setting will be gone, when the Grafana pods is restarted, which might lead to a problem.
While the Grafana serviceaccount does not require cluster permissions, it will require permission to view the appropriate namespace
All above also means, that you actually would need to create a new DataSource for every project you want to monitor. I was not able to find a way, to send multiple namespaces in the URL parameter.
Is it useful to leverage the Grafana operator then at all? Probably yes, since Operators are the future and it is actively developed. Nevertheless, it is always possible to deploy Grafana manually.
Copyright © 2020 - 2024 Toni Schmidbauer & Thomas Jungbauer
Built with Hugo Learn Theme and Hugo