OpenShift
The Guide to OpenBao - Secrets Engines PKI - Part 9
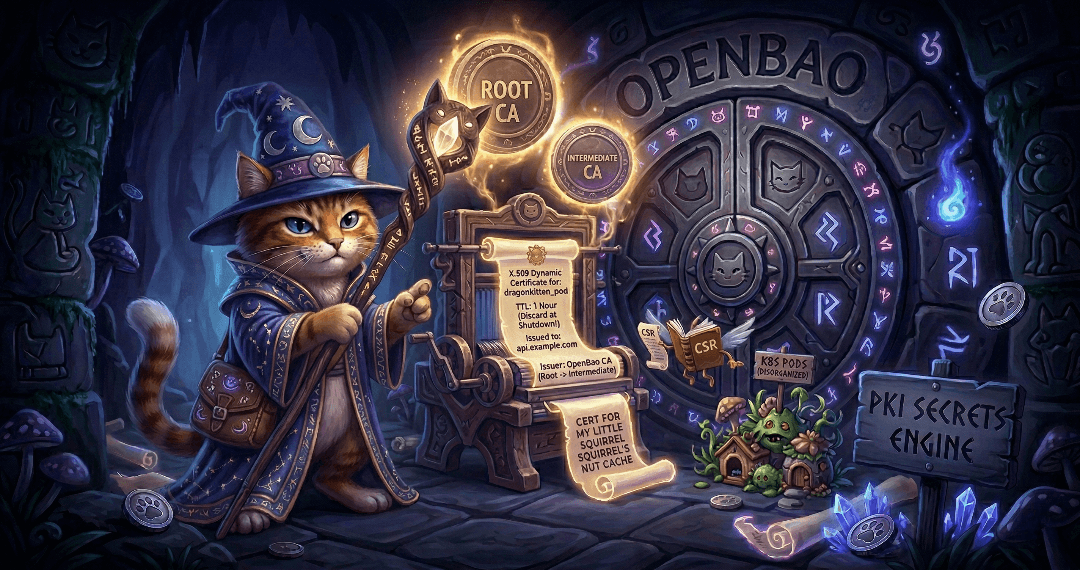
Secrets engines are one of the most important concepts in OpenBao. Part 8 covered the KV secrets engine; this article covers the PKI secrets engine and its integration with cert-manager on Kubernetes and OpenShift.
The Guide to OpenBao - Secrets Engines KV - Part 8
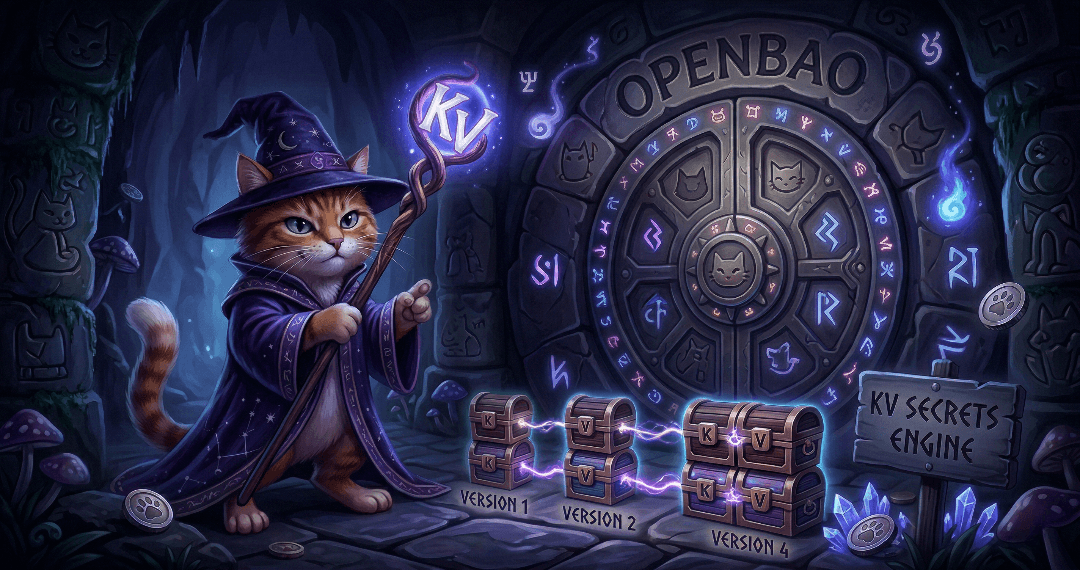
Secrets engines are the heart of OpenBao’s functionality. They store, generate, or encrypt data. This article covers the most commonly used secrets engine: KV for static secrets. It will demonstrate how to use the KV secrets engine to store and retrieve secrets. Upcoming articles will cover the PKI secrets engine and the integration with cert-manager.
The Guide to OpenBao - Authentication Methods - Part 7
With OpenBao deployed and running, the next critical step is configuring authentication. Ultimately, you want to limit access to only authorised people. This article covers two common authentication methods: Kubernetes for pods and LDAP for enterprise directories (in a simplified example). There are many more methods, but we cannot cover them all in this article.
The Guide to OpenBao - Initialisation, Unsealing, and Auto-Unseal - Part 6
After deploying OpenBao via GitOps (Part 5), OpenBao must be initialised and then unsealed before it becomes functional. You usually do not want to do this unsealing manually, since this is not scalable especially in bigger, productive environments. This article explains how to handle initialisation and unsealing, and possible options to configure an auto-unseal process so that OpenBao unseals itself on every restart without manual key entry.
Onboarding to Ansible Automation Platform with Configuration as Code
We had the honor of presenting at the 2nd Ansible Anwendertreffen in Austria. The topic was the onboarding of application teams to the Ansible Automation Platform.
The Guide to OpenBao - GitOps Deployment with Argo CD - Part 5
Following the GitOps mantra "If it is not in Git, it does not exist", this article demonstrates how to deploy and manage OpenBao using Argo CD. This approach provides version control, audit trails, and declarative management for your secret management infrastructure.
The Guide to OpenBao - Enabling TLS on OpenShift - Part 4
In Part 3 we deployed OpenBao on OpenShift in HA mode with TLS disabled: the OpenShift Route terminates TLS at the edge, and traffic from the Route to the pods is plain HTTP. While this is ok for quick tests, for a production-ready deployment, you should consider TLS for the entire journey. This article explains why and how to enable TLS end-to-end using the cert-manager operator, what to consider, and the exact steps to achieve it.
The Guide to OpenBao - OpenShift Deployment with Helm - Part 3
After understanding standalone installation in Part 2, it is time to deploy OpenBao on OpenShift/Kubernetes using the official Helm chart. This approach provides high availability, Kubernetes-native management, and seamless integration with the OpenShift ecosystem.
The Guide to OpenBao - Standalone Installation - Part 2
In the previous article, we introduced OpenBao and its core concepts. Now it is time to get our hands dirty with a standalone installation. This approach is useful for testing, development environments, edge deployments, or scenarios where Kubernetes is not available.
The Guide to OpenBao - Introduction - Part 1
I finally had some time to dig into Secret Management. For my demo environments, SealedSecrets is usually enough to quickly test something. But if you want to deploy a real application with Secret Management, you need to think of a more permanent solution.
This article is the first of a series of articles about OpenBao, a HashiCorp Vault fork. Today, we will explore what OpenBao is, why it was created, and when you should consider using it for your secret management needs. If you are familiar with HashiCorp Vault, you will find many similarities, but also some important differences that we will discuss.
OKD Single node installation in a disconnected environment
Because of reasons we had to set up a disconnected single node OKD "cluster". This is our brain dump as the OKD documentation sometimes refers to OpenShift image locations, we had to read multiple sections to get it working and we also consulted the OpenShift documentation at https://docs.redhat.com.
| Updated on 2026-03-03: Fixed install-config.yaml and create manifest command |
Advanced br-ex Configuration with Bonding on OpenShift
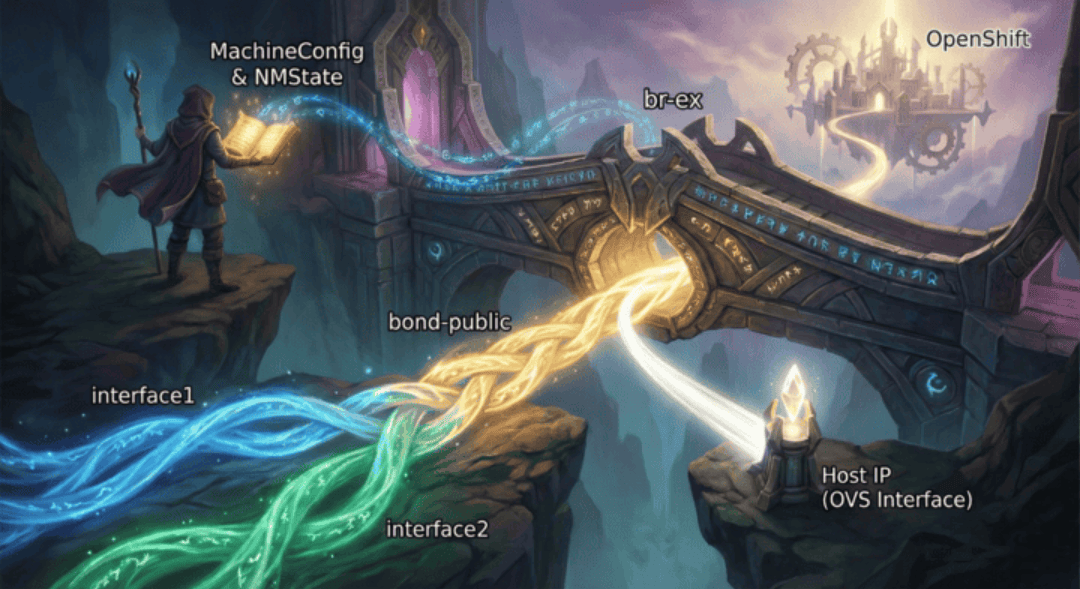
In standard OpenShift Container Platform (OCP) installations, the cluster networking operator relies on default scripts to configure the external bridge, br-ex. While these defaults work for simple setups, production environments frequently demand robust and redundant setups, such as LACP bonding or active-backup configurations that the default scripts cannot guess.
In this article, we explore advanced configurations for the br-ex bridge on OpenShift. We will configure a worker node with a high-availability active-backup bond, attach it to an OVS bridge (br-ex), and ensure the node maintains connectivity.
[Ep.15] OpenShift GitOps - Argo CD Agent
OpenShift GitOps based on Argo CD is a powerful tool to manage the infrastructure and applications on an OpenShift cluster. Initially, there were two ways of deployment: centralized and decentralized (or distributed). Both methods had their own advantages and disadvantages. The choice was mainly between scalability and centralization. With OpenShift GitOps v1.19, the Argo CD Agent was finally generally available. This agent tries to solve this problem by bringing the best of both worlds together. In this quite long article, I will show you how to install and configure the Argo CD Agent with OpenShift GitOps using hub and spoke architecture.
OpenShift Virtualization Networking - The Overview
It’s time to dig into OpenShift Virtualization. You read that right, OpenShift Virtualization, based on kubevirt allows you to run Virtual Machines on top of OpenShift, next to Pods. If you come from a pure Kubernetes background, OpenShift Virtualization can feel like stumbling into a different dimension. In the world of Pods, we rarely care about Layer 2, MAC addresses, or VLANs. The SDN (Software Defined Network) handles the magic and we are happy.
But Virtual Machines are different….
Copyright © 2020 - 2026 Toni Schmidbauer & Thomas Jungbauer


![image from [Ep.15] OpenShift GitOps - Argo CD Agent](https://blog.stderr.at/gitopscollection/images/agent/Logo-ArgoCDAgent.png)
