Welcome to Yet Another Useless Blog
Despite the name, we hope you'll find these articles genuinely helpful! 😊
Who are we?
We're Thomas Jungbauer and Toni Schmidbauer — two seasoned IT professionals with over 20 years of experience each. Currently, we work as architects at Red Hat Austria, helping customers design and implement OpenShift and Ansible solutions.
What's this blog about?
Real-world problems, practical solutions. We document issues we've encountered in the field along with step-by-step guides to reproduce and resolve them. Our goal: save you hours of frustrating documentation searches and trial-and-error testing.
Feel free to send us an e-mail or open a GitHub issue.
Recent Posts
[Ep.15] OpenShift GitOps - Argo CD Agent
OpenShift GitOps based on Argo CD is a powerful tool to manage the infrastructure and applications on an OpenShift cluster. Initially, there were two ways of deployment: centralized and decentralized (or distributed). Both methods had their own advantages and disadvantages. The choice was mainly between scalability and centralization. With OpenShift GitOps v1.19, the Argo CD Agent was finally generally available. This agent tries to solve this problem by bringing the best of both worlds together. In this quite long article, I will show you how to install and configure the Argo CD Agent with OpenShift GitOps using hub and spoke architecture.
OpenShift Virtualization Networking - The Overview
It’s time to dig into OpenShift Virtualization. You read that right, OpenShift Virtualization, based on kubevirt allows you to run Virtual Machines on top of OpenShift, next to Pods. If you come from a pure Kubernetes background, OpenShift Virtualization can feel like stumbling into a different dimension. In the world of Pods, we rarely care about Layer 2, MAC addresses, or VLANs. The SDN (Software Defined Network) handles the magic and we are happy.
But Virtual Machines are different….
GitOps Catalog
The GitOps Catalog page provides an interactive visualization of all available ArgoCD applications from the openshift-clusterconfig-gitops repository. Check out the page GitOps Catalog for more details.
Hosted Control Planes behind a Proxy
Recently, I encountered a problem deploying a Hosted Control Plane (HCP) at a customer site. The installation started successfully—etcd came up fine—but then it just stopped. The virtual machines were created, but they never joined the cluster. No OVN or Multus pods ever started. The only meaningful message in the cluster-version-operator pod logs was:
Helm Charts Repository Updates
This page shows the latest updates to the stderr.at Helm Charts Repository. The charts are designed for OpenShift and Kubernetes deployments, with a focus on GitOps workflows using Argo CD.
| The content below is dynamically loaded from the Helm repository and always shows the most recent changes. |
The Hitchhiker's Guide to Observability - Limit Read Access to Traces - Part 8
In the previous articles, we deployed a distributed tracing infrastructure with TempoStack and OpenTelemetry Collector. We also deployed a Grafana instance to visualize the traces. The configuration was done in a way that allows everybody to read the traces. Every system:authenticated user is able to read ALL traces. This is usually not what you want. You want to limit trace access to only the appropriate namespace.
In this article, we’ll limit the read access to traces. The users of the team-a namespace will only be able to see their own traces.
The Hitchhiker's Guide to Observability - Here Comes Grafana - Part 7
While we have been using the integrated tracing UI in OpenShift, it is time to summon Grafana. Grafana is a visualization powerhouse that allows teams to build custom dashboards, correlate traces with logs and metrics, and gain deep insights into their applications. In this article, we’ll deploy a dedicated Grafana instance for team-a in their namespace, configure a Tempo datasource, and create a dashboard to explore distributed traces.
The Hitchhiker's Guide to Observability - Adding A New Tenant - Part 6
While we have created our distributed tracing infrastructure, we created two tenants as an example. In this article, I will show you how to add a new tenant and which changes must be made in the TempoStack and the OpenTelemetry Collector.
This article was mainly created as a quick reference guide to see which changes must be made when adding new tenants.
The Hitchhiker's Guide to Observability - Understanding Traces - Part 5
With the architecture established, TempoStack deployed, the Central Collector configured, and applications generating traces, it’s time to take a step back and understand what we’re actually building. Before you deploy more applications and start troubleshooting performance issues, you need to understand how to read and interpret distributed traces.
Let’s decode the matrix of distributed tracing!
The Hitchhiker's Guide to Observability - Example Applications - Part 4
With the architecture defined, TempoStack deployed, and the Central Collector configured, we’re now ready to complete the distributed tracing pipeline. It’s time to deploy real applications and see traces flowing through the entire system!
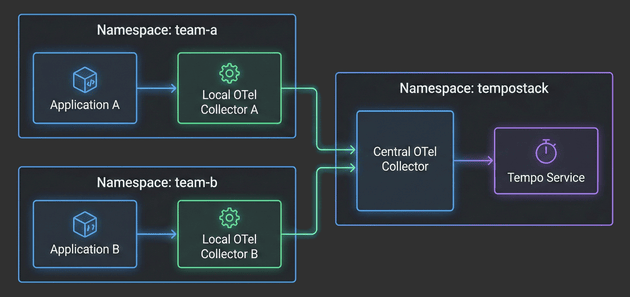
In this fourth installment, we’ll focus on the application layer - deploying Local OpenTelemetry Collectors in team namespaces and configuring example applications to generate traces. You’ll see how applications automatically get enriched with Kubernetes metadata, how namespace-based routing directs traces to the correct TempoStack tenants, and how the entire two-tier architecture comes together.
The Hitchhiker's Guide to Observability - Central Collector - Part 3
With the architecture defined in Part 1 and TempoStack deployed in Part 2, it’s time to tackle the heart of our distributed tracing system: the Central OpenTelemetry Collector. This is the critical component that sits between your application namespaces and TempoStack, orchestrating trace flow, metadata enrichment, and tenant routing.
The Hitchhiker's Guide to Observability - Grafana Tempo - Part 2
After covering the fundamentals and architecture in Part 1, it’s time to get our hands dirty! This article walks through the complete implementation of a distributed tracing infrastructure on OpenShift.
We’ll deploy and configure the Tempo Operator and a multi-tenant TempoStack instance. For S3 storage we will use the integrated OpenShift Data Foundation. However, you can use whatever S3-compatible storage you have available.
The Hitchhiker's Guide to Observability Introduction - Part 1
With this article I would like to summarize and, especially, remember my setup. This is Part 1 of a series of articles that I split up so it is easier to read and understand and not too long. Initially, there will be 6 parts, but I will add more as needed.
What's new in OpenShift, 4.20 Edition
This article covers news and updates in the OpenShift 4.20 release. We focus on points that got our attention, but this is not a complete summary of the release notes.
Copyright © 2020 - 2026 Toni Schmidbauer & Thomas Jungbauer
![image from [Ep.15] OpenShift GitOps - Argo CD Agent](https://blog.stderr.at/gitopscollection/images/agent/Logo-ArgoCDAgent.png)
